R Markdown is an extremely useful tool for producing reports using R. The problem is that decent quality reports require captions for figures and tables, and it is not straightforward to do. The good news is that it is still quite easy.
Pandoc’s Markdown: numbered captions
The key to adding captions is that
knitr actually
converts your .Rmd file to .md file first, and then uses
pandoc to conert it to html, pdf or another format.
Therefore, everything that works in Pandoc also works in R Markdown. It is worth
noting, though, that Pandoc uses its own extended version of Markdown called
Pandoc’s Markdown. Among other
things it allows captioning your figures and tables. This is done in the
following way for the figures

and in the following way for the tables
| Column heading 1 | Column heading 2 |
| -----------------| -----------------|
| Some value       | Another values   |
| One more values  | And the last one |

Table: Example of a table with a caption.
If you want you result in a PDF format, then the default Pandoc settings would render image caption below an image, tables captions above a table. Moreover, it would automatically number it. Note, however, that this is not the case for other formats and, therefore, in this post I will focus only on PDF output.
LaTeX: cross-references
knitr firs converts to Markdown and then using Pandoc converts to whatever
format you want. In our case we want PDF. And for PDF it first converts to
LaTeX (at least, using the default pandoc
settings), and then compiles it to PDF. This additional layer is useful for us,
because it allows using LaTeX features in our (R) Markdown files. For example,
we can add formulas by enclosing them in dollar signs, like this:
$Y \sim N(0, 1)$. Or we reference our tables inside the text with the help of
LaTeX capabilities. To do that, we should add \label{some-label} into caption
and then \\ref{some-label} to get the number of the referenced element in the
text.
Adjusting the example above, it would look like this (in this example we have
also changed the size of an image by adding {width=250px}):
{width=250px}
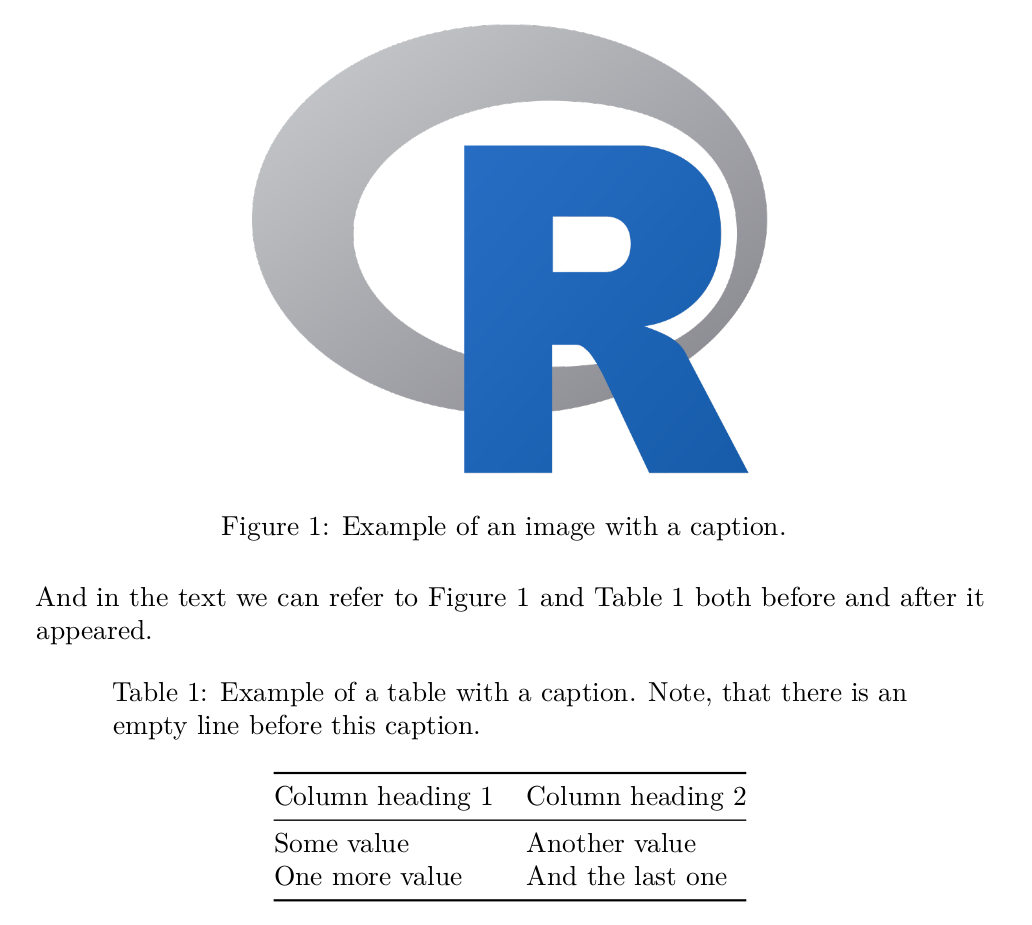
And in the text we can refer to Figure \ref{fig:example-figure} and Table
\ref{tab:example-table} both before and after it appeared.
| Column heading 1 | Column heading 2 |
| -----------------| -----------------|
| Some value | Another values |
| One more values | And the last one |
Table: Example of a table with a caption. Note, that there is an empty line
before this caption. \label{tab:example-table}
This is how it looks after compiling it to pdf (in the command line:
pandoc pandoc-example.md -o pandoc-example.pdf`
where pandoc-example.md is our Markdown input, and we want a PDF output):
R Markdown: combining both
If you are just adding images from a source file and manual tables to you R Markdown file, then the syntax above should work just fine. However, what should we do if we generate the images and tables dynamically?
Tables
Let us start with tables, because it is a little bit easier. If you want a
beatiful nicely-formatted table, you can use knitr::kable function (I guess it
stands for “knitr table”, rather than “cable”). For example:
```{r}
data(iris)
knitr::kable(head(iris))
```
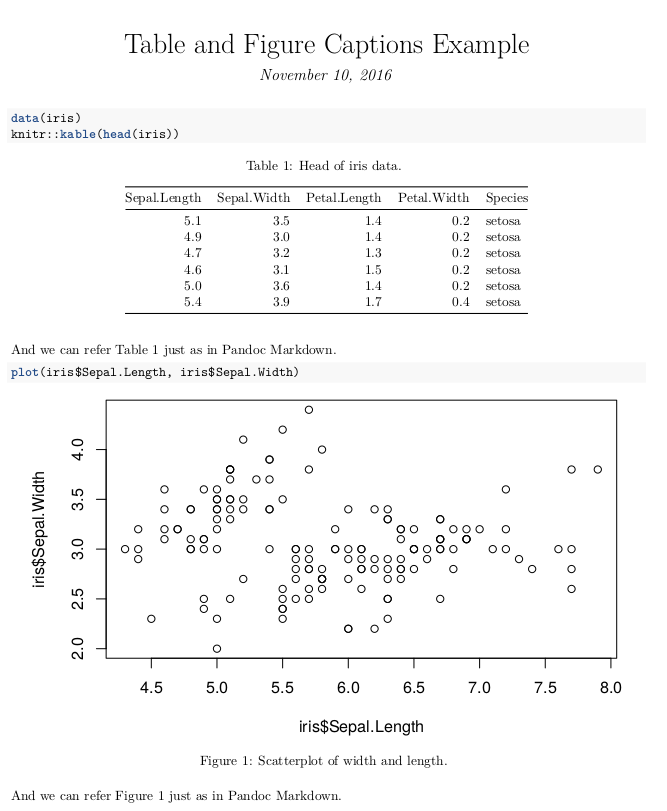
Table: Head of iris data. \label{tab:iris}
And we can refer Table \ref{tab:iris} just as in Pandoc Markdown.Images
Images are a little bit trickier. We cannot just use the Pandoc approach, because we use a completely different syntax, when we generate figures dynamically. Luckily, R Markdown has a built-in way of adding captions.
First, we need to add the following lines to our heading/front matter: the text
between --- and --- at the very top of the document
output:
  pdf_document:
    fig_caption: yes
And now we can add captions to the code chunks with a fig.cap option. Like
this:
```{r, fig.cap="Scatterplot of width and length. \\label{fig:iris}"}
plot(iris$Sepal.Length, iris$Sepal.Width)
```

And we can refer Figure \ref{fig:iris} just as in Pandoc Markdown.
Note the double backslash, it is needed because in strings it serves an escape character, and to make and actual backslash we need to escape it with a backslash first, which, obviously, results in a double backslash.
Result
Combining the table and the figure examples, we get the something like this:
A reproducible example of the image above can be fount here.